

Tableau Complete Project Guide Course helps you master data visualization with real-world steps, dashboards, and boost analytics skills.
Introduction to Tableau Complete Project Guide Course
Every great data visualization project begins with a structured approach. This Tableau Complete Project Guide Course is designed to take you through a real-world workflow, step by step. Instead of just learning isolated features, you’ll understand the full process—how to start with raw requirements, transform them into insights, and finally build interactive dashboards that drive decisions.
By the end of this course, you’ll feel confident not only in handling Tableau but also in applying it to real projects with clarity, strategy, and design thinking.
Step 1: Understanding the Project Process
The first step in any Tableau Complete Project Guide Course is to grasp the bigger picture. Here, we break down how professionals approach projects from kickoff to delivery. You’ll learn how to:
- Define project objectives clearly.
- Establish success criteria with measurable outcomes.
- Understand stakeholders and their data needs.
- Map out phases for data preparation, design, and delivery.
This structured roadmap ensures that your project flows smoothly from start to finish.
Step 2: Analyse Requirements for Clarity
No project succeeds without crystal-clear requirements. In this phase, you’ll explore:
- Gathering business questions directly from stakeholders.
- Identifying key performance indicators (KPIs).
- Understanding the purpose of reports (operational vs. strategic).
- Prioritizing requirements to avoid dashboard overload.
Requirement analysis acts as the foundation—helping you decide what data matters most before even touching Tableau.
Step 3: Draw Mockups & Choose Colors
Visualization is more than charts—it’s communication. This section emphasizes design planning before development. You’ll practice:
- Sketching wireframes or mockups for dashboard layout.
- Selecting a consistent color palette that enhances readability.
- Applying data visualization principles for accessibility.
- Using colors to highlight trends, not distract users.
A clear mockup reduces rework later and aligns everyone on the design direction.
Step 4: Build a Strong Data Source
A Tableau Complete Project Guide Course is incomplete without strong data foundations. Here, you’ll learn:
- Connecting Tableau to multiple data sources.
- Cleaning and preparing datasets for accuracy.
- Creating relationships between tables for deeper insights.
- Implementing calculated fields and hierarchies for flexibility.
With a solid data model, dashboards run faster and deliver reliable results.
Step 5: Create BANS for Quick Insights
Business Analytics Numbers (BANS) are the simplest way to showcase performance at a glance. You’ll discover:
- How to calculate KPIs like revenue, profit, or customer count.
- Designing minimal yet impactful number cards.
- Using conditional formatting to highlight targets vs. actuals.
BANS work as the “headline” of a dashboard—delivering instant answers to critical questions.
Step 6: Visualize Sales & Profit by Category
Categorical analysis helps businesses see which segments drive growth. In this section:
- Build bar and tree charts for category comparisons.
- Apply filtering and sorting to focus on top categories.
- Explore dual-axis visuals for combined metrics.
- Emphasize categories that underperform for corrective action.
This ensures dashboards don’t just show results—they reveal opportunities.
Step 7: Discover Trends Over Time
Time-based analysis is the heartbeat of strategic decision-making. In this stage, you’ll master:
- Line charts to display revenue and profit growth.
- Trendlines to predict future movement.
- Seasonality detection for monthly or quarterly cycles.
- Highlighting anomalies like sudden drops or spikes.
This brings storytelling into dashboards, letting users see how performance evolves over time.
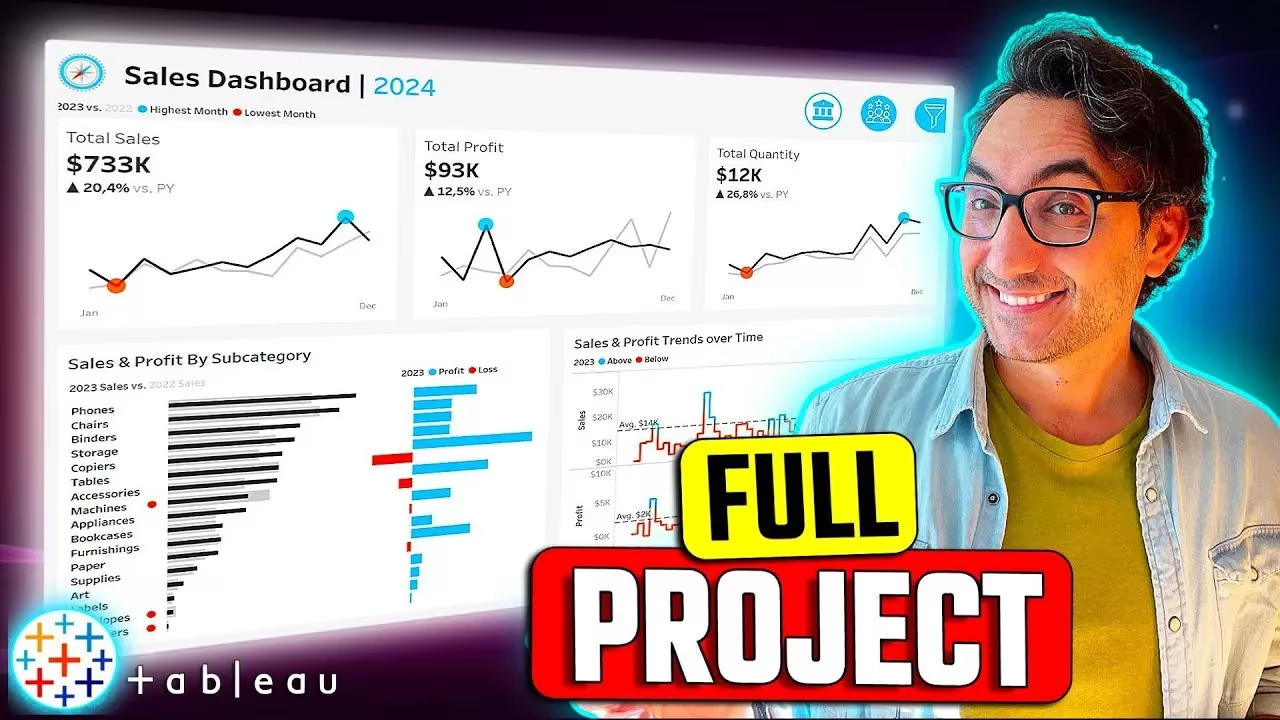
Step 8: Build the Sales Dashboard
With the charts ready, it’s time to bring them together into a polished dashboard. Here’s what you’ll focus on:
- Combining BANS, category visuals, and trend charts.
- Adding interactive filters for user-driven exploration.
- Designing a clean layout that balances detail with simplicity.
- Ensuring responsiveness across screen sizes.
The Sales Dashboard becomes the go-to tool for executives to monitor business health.
Step 9: Build the Customer Dashboard
The final step of this Tableau Complete Project Guide Course zooms in on customer behavior. You’ll learn to:
- Segment customers by geography, spend, or frequency.
- Highlight customer lifetime value metrics.
- Use heatmaps for regional performance.
- Create retention-focused visuals that reveal loyalty patterns.
A customer dashboard enables businesses to align sales strategies with client needs, boosting long-term growth.
Why This Course Stands Out
Unlike surface-level resources, this course emphasizes real-world application. You’ll not only gain technical knowledge but also understand how Tableau projects unfold in professional environments.
Key highlights include:
- A structured project process from start to finish.
- Practical steps that mirror workplace scenarios.
- Actionable dashboards that answer business-critical questions.
- Insights into both design and analytics best practices.
This way, you’re not just learning Tableau—you’re preparing to lead projects confidently.
Conclusion of Tableau Complete Project Guide Course
The Tableau Complete Project Guide is more than a learning resource—it’s a career investment. Whether you’re a beginner exploring data visualization or a professional seeking to refine workflow, this course equips you with the full cycle of skills: from understanding requirements to delivering dashboards that matter.
By following this structured journey, you’ll transform raw data into powerful business intelligence tools, ready to make an impact in any industry.